Technology has hit the ground, and it is continually providing us solutions to various problems. It’s good we further understand how to read and interpret thermography images. When thermal cameras are turned on, they will record the temperature they pick from an object at large. This is what will help thermal imager users to make further analysis.
The thermal heat from surfaces or objects is turned into color, which is later displayed on the screen. These are what we call thermograms. The information of the object is captured by the camera once the shut off button is pressed. Are you in need to understand how to read thermography images?
What Do the Colors Mean in Thermography?
The thermal imagers are generally employed in different fields to boost the visibility of objects. These devices are capable of detecting some heat from everything on earth, either living or non-living. Infrared radiation they emit helps to carry out further analysis of the object in the subject.
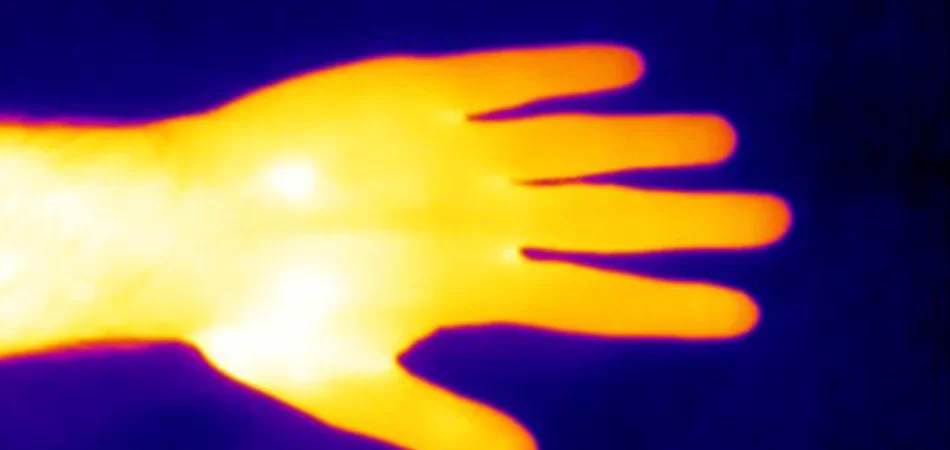
Thermal cameras don’t display real images of objects on the screens. Instead, the camera receives a thermogram. This is the object’s information based on its temperature, and it is displayed in different colors. The level of the brightness of thermograms differs from an object to the other. Warmer objects are displayed in brighter colors, and the brightness reduces as the temperature lowers. This is the simplest answer that has answered the question of the meaning of thermography colors. Let’s remain tuned reading to get what the colors mean deeper.
The thermogram colors are based around yellow, dark blue, red, grey, purple, dark or black, and orange glow from the subject’s object. Objects that emit more radiations produce colors based around yellow, red, and orange. The color that shows up depends on the level of warmth or temperature of the object emitting the radiation.
There are images that show up colors based around the darker part, likdark blue and purple. This is a symbol of objects emitting less infrared radiation, and probably they have low temperatures.
The mild brighter colors like yellow, red, and orange indicate a temperature of around 23 degrees Celsius. The colors become brighter when the temperatures of the objects go beyond even 62 degrees Celsius as such.
The black and darker options, on the other hand, represent low temperatures. The darker the color is, the colder the object in the subject. Darker colors represent temperatures closer to zero degrees Celsius.
In general, the color presentations are as follows:
- Black – Coldest area
- Purple & Blue – Slightly hotter
- Red, Orange, and Yellow – Mid-range temperature
- White – Hottest area
Moreover, you can see grayscale images in a thermal camera. The greyscale comes whenever there are black and white colors passing through different shades. This represents a difference in temperature levels in different parts of an object. However, this is a rare case you will see with thermal cameras.
How to Read Thermography Images?
We already have an idea about the meaning of different thermography colors. But, do you understand how to read thermography images? Let’s have a more in-depth look at how to read the images from the thermal cameras in this post.
The thermal cameras don’t detect the color of objects. This is because they operate in infrared ranges that are beyond that of visible light. They usually record an object’s thermal information. This is displayed in the easiest way so that people can interpret visually in the form of an image.
The interpretation process has been simplified in that the images are represented using colors. The colors are regarded as false. They are just representations of a difference in the temperature of the object in the subject. The commonly employed false-color option is referred to as the Iron one.
Next to the false color is a small scale. This provides an individual with an idea of the colors employed and the various temperature levels they cover. This enables users to get a proper idea of the actual temperature of a particular object. When reading thermography images, the false colors don’t represent a specific temperature. These colors are just employed to distinguish the hottest and coldest parts of objects or surfaces.
There are several thermal cameras in the market whose output is in the form of videos. For these, the white color signifies areas with maximum emission of radiated energy. Black, on the other hand, indicates areas with minimum radiations.
Thermal cameras are employed for several applications. The applications of these devices are qualitative at large. Usual inspections involve making a comparison of temperatures that falls within a field of view of various locations.
When interpreting thermography images, environmental elements and factors play a role. The elements like sun, subsurface detail, moisture, wind, and shadow. These elements can affect the outcome and therefore ensure they are looked at when using the thermal cameras.
Overall, great care is the main thing thermal camera users should exercise to get qualitative results from these devices. The number of radiations an object or surface emits depends on its emissivity at large. Therefore, accurate emissivity assessment is essential if you deem for meaningful results.
Summary
Have you grasped the concept of how to read thermography images? There is a need for practice if you need to understand how to read images from thermal cameras. Understand the correct usage of the devices and what the color displayed on the screen means.
Even if the body temperatures of animals can be similar, they appear differently on the thermal imagers. For this reason, there is a need you grasp every detail about these devices for you to get the best results from them. Therefore, let’s conclude that the brighter the displayed color, the warmer the surface or object at hand.


